- 总述
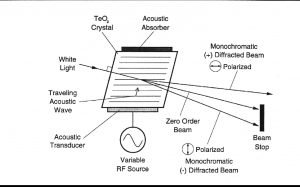
AOTF的原理是基于光在各向同性介质中的声衍射,该装置由一个压电传感器与一个双折射仪连接在一起构成,当传感器被应用的射频信号激活时,会在晶体中产生声波。传播声波产生了折射率的周期性调制,这提供了一个移动光栅,在适当的条件下,会衍射部分入射光束。对于固定声频,窄频段的光频满足匹配条件,并累积衍射。随着RF频率的变化,光带的中心也会相应地改变,从而保持相位匹配条件。
The near infrared region of the spectrum extends from 800nm to 2500nm. The absorption bands that are most prominent in this region are due to overtones and combinations of the fundamental vibrations active in the mid-infrared region. The energy transitions are between the ground state and the second or third excited vibrational states. Because higher energy transitions are successively less likely to occur, each overtone is successively weaker in intensity. Because the energy required to reach the second or third excited state is approximately twice or three times that needed for a first order transition and the wavelength of absorption is inversely proportional to the energy, the absorption bands occur at about one-half and one-third the wavelength of the fundamental. In addition to the simple overtones, combination bands also occur. These usually involve a stretch plus one or more bending of rocking modes. Many different combinations are possible and therefore the NIR region is complex, with many band assignments unresolved.
Near Infrared Spectroscopy is currently being used as a quantitative tool which relies on chemometrics to develop calibrations relating a reference analysis of the constituent to that of the NIR optical spectrum. The mathematical treatment of NIR data includes Multi Linear Regression (MLR), Principle Component Analysis (PCR), Partial Least Squares (PLS) and discriminant analysis. All of these algorithms can be used singularly or in combination to yield the resultant goal of quantitative prediction and qualitative description of the constituents of interest.
- Purpose
Polymers are composed of monomers that are made up of simple hydrocarbon chains. Often these chains are modified by halogens and other inorganic elements. Often these changes are subtle and will not produce variation between polymers so that a visual method of classification is possible. But the variations in the hydrocarbon chains produce variation in spectra by the shifting of peaks and addition and removal of peaks. Brimrose AOTF-NIR technology has the capability to resolve these subtle peaks so that no two polymers will appear to be the same spectroscopically. This will allow for a qualitative method of analysis to be implemented to identify polymers from one another. Brimrose AOTF-NIR technology will allow for dependable, portable, and accurate analysis due to the speed and compact design of the spectrometers. The details of this report will indicate the effectiveness of Brimrose AOTF-NIR technology to identify various polymers.
III. Methodology
A Brimrose AOTF-NIR Lumanir 5030 handheld spectrometer was utilized to obtain the spectra of various polymers. The optical unit of the spectrometer was placed directly on the surface of the polymers to obtain spectra. The acquisition parameters are as follows:
| NIR Region | 1100 nm to 2300 nm |
| Resolution | 2 nm |
| Gain | 1 X |
| Scans Per Average | 200 |
| Sampling Type | 200 |
| Data Format | Absorbance |
Table 1. Acquisition Parameters
Each Polymer was scanned a number of times at different locations to factor in uniformity. The spectra was then imported into the Unscrambler Chemometric Software, and a principle component analysis (PCA)[i] was performed.
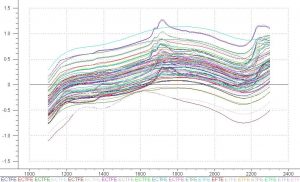
Figure 2 is a plot of scans of all of the polymers. This plot contains a baseline offset; therefore a corrective pre-treatment must be utilized. One pre-treatment that corrects for this offset and increases resolution is a second derivative. Second derivative increases the noise in the spectra, so a Savitzky Golay[i] filtering algorithm will be utilized to reduce the noise created by the second derivative. The resultant spectra is shown below.
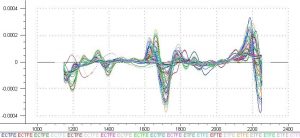
Figure 4 is the spectra with a second derivative pretreatment. The organic region of the NIR spectrum is located from 1350 nm to 1440 nm, this region will be expanded to 1300 nm to 1460 nm to allow for shifts due to fluorination. This region is shown in the figure below.
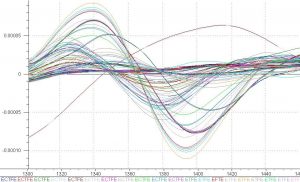
Figure 5 shows the variation in spectra between polymers. This variation confirms that subtle changes in the hydrocarbon chains of the polymers produce enough variability spectroscopically so that a qualitative method of analysis can be implemented.
PCA
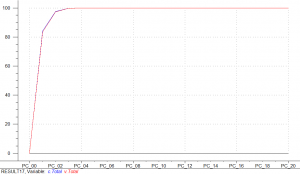
Figure 6 is a plot of explained variance as a function of the number of principle components (PC)[i] used in the model. Figure 6 shows that three PCs explain 99.7 percent of the variability between polymers, with 84 percent of the variability explained in the first PC and 13 percent in the second PC. This demonstrates the by using the wavelengths between 1300 nm to 1460 nm, the variation between all of the polymers can be explained quite easily with only three PCs.
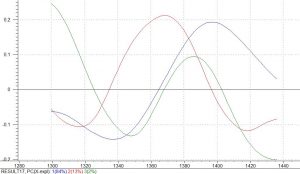
Figure 7 illustrates which variables best explain the variation between the polymers. There are 3 very distinct peaks that account for the all variations.
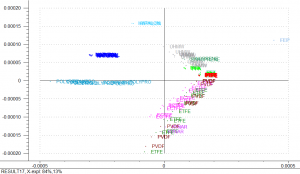
Figure 8 is a visual representation of variation between spectra. Figure 8 exhibits clustering of scans of the sample polymer. This clustering will allow for qualitative analysis.
- Conclusion and Discussions
The results that were conveyed in this report proves that a Brimrose Luminary 5030 AOTF-NIR spectrometer can provided for a qualitative method of analysis for polymers. The results can be improved by fine-tuning the acquisition parameters. But the most improvement will result from addition of more samples into the PCA model.
Since the model is using a region of the spectrum that only contains 160 wavelengths, the method of analysis is extremely efficient, a typical analysis would only take a few second to produce accurate and precise results. If greater accuracy is needed, the number of scans per sample can be increased without increasing the scanning time greatly.
The Brimrose AOTF-NIR Luminar 5030 spectrometer is the ideal tool for real-time, on-line and field measurements. The AOTF technology allows for fast scanning using no moving parts and without the need to recalibrate the system. The results of this study proved the feasibility of determining the polymer type of the samples provided with a Brimrose AOTF-NIR Luminar 5030 spectrometer. It is recommended that further discussion be held to determine the best means for implementing a Brimrose AOTF-NIR Luminar Spectrometer to classify products by their polymer type.
[1] Principle Component Analysis: is a bilinear modeling method, which gives an interpretable overview of the main information in a multidimensional data table.
[1] Savitzky Golay: is an averaging algorithm that fits a polynomial to the data points. The value to be averaged is then predicted from this polynomial equation.
[1] Explained Variance: often measured as a percentage of the total variance in the data, is a measurement of the proportion of variation in the data accounted for by the current PC
[1] Principal Components (PCs): are composite variables, i.e. linear functions of the original variables, estimated to contain, in decreasing order, the main structured information in the data. A PC is the same as a score vector, and is also called a latent variable
[1] Loadings: are estimated in bilinear modeling methods where information carried by several variables is concentrated onto a few components. Each variable has a loading along each model component. The loadings show how well a variable is taken into account by the model components.
[1] Scores: describe the data structure in terms of sample patterns, and more generally show sample differences or similarities.