I. 操作摘要
使用Brimrose自由空间光谱仪收集含有聚合物添加剂的五种化合物的光谱,其中的三种样品含有高浓度的添加剂,另外两种样品是含有这些添加剂的树脂。光谱显示了所有五个样本之间的明显区别,PCA回归证实Brimrose自由空间光谱仪能够区分这五种化合物。光谱显示了清晰的波峰,包含了可以用于定量分析此类化合物中添加剂水平的相关光谱信息。下一步是获取含有已知不同水平添加剂的样品,并使用Brimrose光谱仪收集用于PLS1分析的光谱,该光谱可用于创建一个模型,可以定量分析添加剂在这些化合物中的水平。
II.简介
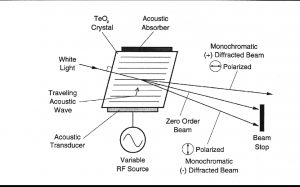
声光可调滤波器(AOTF)的原理基于光在各向异性介质中的声折射。装置由粘在双折射晶体上的压电导层构成。当导层被应用的射频(RF)信号激发时,在晶体内产生声波。传导中的声波产生折射率的周期性调制。这提供了一个移动的相栅,在特定条件下折射入射光束的部分。对于一个固定的声频,光频的一个窄带满足相匹配条件,被累加折射。RF频率改变,光的带通中心相应改变以维持相匹配条件。
光谱的近红外范围从800nm到2500 nm延伸。在这个区域最突出的吸收谱带归因于中红外区域的基频振动的泛频和合频。是基态到第二激发态或第三激发态的能级跃迁。因为较高能级跃迁连续产生的概率较小,每个泛频的强度连续减弱。由于跃迁的第二或第三激发态所需的能量近似于第一级跃迁所需能量的二倍或三倍,吸收谱带产生在基频波长的一半和三分之一处。触简单的泛频以外,也产生合频。这些通常包括延伸加上一个或多个振动方式的伸缩。大量不同合频是可能的,因而近红外区域复杂,有许多谱带彼此部分叠加。
现在,NIRS被用作定量工具,它依赖化学计量学来发展校正组成的参照分析和近红外光谱的分析的关联。近红外数据的数学处理包括多元线性回归法(MLR)、主成分分析法(PCA)、主成分回归法(PCR)、偏最小二乘法(PLS)和识别分析。所有这些算法可以单独或联合使用来得到有价值组成的定性描述和定量预测。
III. Methodology
- Data Collection
A Brimrose Free Space spectrometer was used to collect absorbance spectra of five samples containing additives. Each sample was placed in a large petri dish and leveled out. The instrument was tested and adjusted for maximum signal. 200 scans were collected for each reading and averaged into one spectrum. As the instrument was scanning, the petri dish was moved back and forth and around in circles to allow the instrument to scan the entire surface of the sample contained in the dish. The samples were kept at the objective distance of 40 mm. 5 spectra were taken for each sample for a total of 25 spectra. All raw spectral data was taken in reflectance mode with 2nm resolution. Wavelength range was between 1100nm and 2300nm. Spectra were processed into absorbance and first derivative and imported into Unscrambler for modeling.
IV.Results
- Spectra
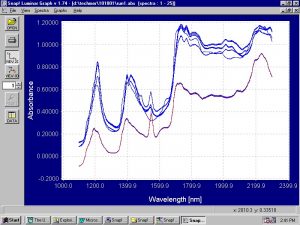
Figure 2. Absorbance spectra of all 5 samples containing additives.
The spectra show clear peaks around 1200, 1400, and 1550 nm. The loading weights for the PCA analysis will confirm that these peaks can be used to distinguish between these 5 compounds and could also probably be used for quantitative analysis of additive level in these compounds.

Figure 3. Absorbance spectra of sample PPM 11174
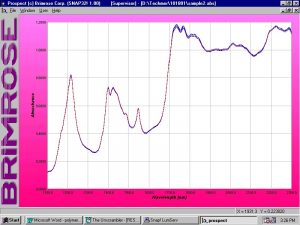
Figure 4. Absorbance spectra of sample PPM11421E63

Figure 5. Absorbance spectra of sample PM 11025E4
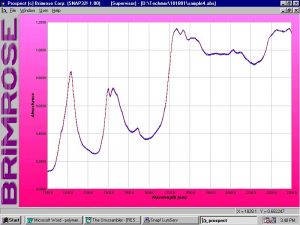
Figure 6. Absorbance spectra of LDPE RESIN
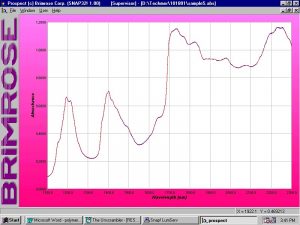
Figure 7. Absorbance spectra of PP RESIN
2.Modeling and Regressions
PCA analysis was performed on the absorbance spectra using Unscrambler. PCA analysis was also performed on the first derivative spectra but the results were much better using the absorbance data. The PCA analysis shows that all 5 samples can be clearly distinguished from one another using the Brimrose spectrometer and that the information used to distinguish the samples from one another comes from the wavelength ranges where the spectral peaks occur.
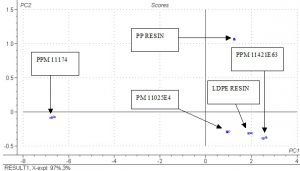
Figure 8. Scores plot for PCA analysis of all 5 sample sets.
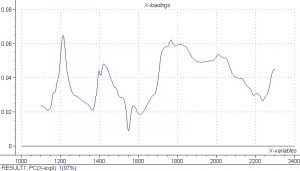
Figure 9. X-Loading weights plot for PCA analysis of 5 samples.
The scores plot shown in Figure 8 shows that the Brimrose Free Space Luminar 2030 is able to distinguish between all 5 samples in this study. The 5 sets of data points are clearly separated from one another. Figure 9 shows that the information used for separating the samples using the spectra comes from the same wavelength ranges where the spectra peaks occur. Both the absorbance spectra and the loading weights have peaks around 1200, 1400, and 1550 nm. This is a good indication that these peaks contain the spectral information necessary to create a regression model that could quantify the amount of additive in the samples.
V. Conclusions and Recommendations
It is concluded that the Brimrose Free Space spectrometer can be used to qualitatively analyze the 5 samples used in this study. There are clear spectral differences that can be seen from looking at the spectra and the PCA analysis makes it even clearer that the five samples can be distinguished using spectral data. The fact that the PCA analysis takes its information from the same wavelengths where the spectral peaks occur indicates that these peaks can probably be used to quantify the amount of additive found in these samples. It is recommended that Brimrose receive quantities of the same samples with known different amounts of additives. Brimrose will conduct a similar study collecting spectral data and using the data for PLS1 analysis, which will show if it is feasible to set up a model to quantitatively analyze the amount of additives in the samples.