Brimrose AOTF-NIR光谱法测定各种混合物中%PMC,PVA和酪醇的含量
I. 操作总结
本研究表明,使用Brimrose AOTF-NIR光谱仪确定这些化合物的各种混合物中的PVA,PMC和Casucol的百分比含量是可行的。使用通过光纤连接到Brimrose光谱仪的全束探头收集数据。光谱仪将收集实时在线数据,每1-2秒1次。进一步的研究和校准将使Brimrose光谱仪能够用于实时在线混合控制和工艺生产线中的实时产品控制。Brimrose的光谱仪非常坚固,没有运动部件,对机械振动和环境变化不敏感,使其成为工业环境中在线过程控制的理想仪器设备。
II.简介
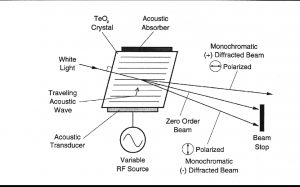
声光可调滤波器(AOTF)的原理基于光在各向异性介质中的声折射。装置由粘在双折射晶体上的压电导层构成。当导层被应用的射频(RF)信号激发时,在晶体内产生声波。传导中的声波产生折射率的周期性调制。这提供了一个移动的相栅,在特定条件下折射入射光束的部分。对于一个固定的声频,光频的一个窄带满足相匹配条件,被累加折射。RF频率改变,光的带通中心相应改变以维持相匹配条件。
光谱的近红外范围从800nm到2500 nm延伸。在这个区域最突出的吸收谱带归因于中红外区域的基频振动的泛频和合频。是基态到第二激发态或第三激发态的能级跃迁。因为较高能级跃迁连续产生的概率较小,每个泛频的强度连续减弱。由于跃迁的第二或第三激发态所需的能量近似于第一级跃迁所需能量的二倍或三倍,吸收谱带产生在基频波长的一半和三分之一处。触简单的泛频以外,也产生合频。这些通常包括延伸加上一个或多个振动方式的伸缩。大量不同合频是可能的,因而近红外区域复杂,有许多谱带彼此部分叠加。
现在,NIRS被用作定量工具,它依赖化学计量学来发展校正组成的参照分析和近红外光谱的分析的关联。近红外数据的数学处理包括多元线性回归法(MLR)、主成分分析法(PCA)、主成分回归法(PCR)、偏最小二乘法(PLS)和识别分析。所有这些算法可以单独或联合使用来得到有价值组成的定性描述和定量预测。
III. 方法
- 数据收集
The samples consisted of a white powder contained in small vials and consisted of varying
percentages of the following constituents:
- PMC-50U (Cellulose ether)
- PVA (polyvinylalcohol)
- Casucol (starch ether)
There were 10 total pre-prepared samples. 7 samples had actual values were and the remaining 3 samples were classified as unknowns. There were also 100 grams each of the pure form of the three constituents. Additional samples were prepared using the pure form of each constituent. A precision balance accurate to 0.1 mg was used to weigh the powder. Blending was done by vigorously shaking the mixture for approximately a minute.
All samples were scanned using the AOTF-NIR spectrometer with a full bundle transflectance probe. The probe was placed in each sample such that its weight was the only force to compact the sample. This minimized error in collecting data from the samples because the varying degree of compaction of particles plays a part in the scatter and reflection of light. The spectral range was 1200nm to 2300nm with each spectrum consisting of an average of 200 scans. The data were collected directly in the absorption mode. The spectral data were entered into The Unscramblerä and PLS 1 regression analysis was performed on each of the constituents.
IV. Results
- Sample weights
| Samples Prepared by Brimrose | ||||||
| SAMPLE | Wt. PMC | Wt. PVA | Wt. Casucol | % PMC | % PVA | % Casucol |
| 1 | 4.9062 | 0.0580 | 0.0272 | 98.29 | 1.16 | 0.54 |
| 2 | 4.8098 | 0.0806 | 0.1050 | 96.28 | 1.16 | 2.10 |
| 3 | 4.7725 | 0.0278 | 0.2000 | 95.44 | 0.56 | 4.00 |
| 4 | 4.7344 | 0.1061 | 0.1744 | 94.41 | 2.12 | 3.48 |
| 5 | 4.6193 | 0.1520 | 0.2250 | 92.45 | 3.04 | 4.50 |
| 6 | 4.5562 | 0.2246 | 0.2501 | 90.56 | 4.46 | 4.97 |
| 7 | 4.4148 | 0.1256 | 0.4489 | 88.49 | 2.52 | 9.00 |
| 8 | 4.3308 | 0.3498 | 0.3004 | 86.95 | 7.02 | 6.03 |
| 9 | 4.2640 | 0.3995 | 0.3505 | 85.04 | 7.97 | 6.99 |
| 10 | 4.1985 | 0.4241 | 0.3741 | 84.03 | 8.49 | 7.49 |
| 11 | 4.1182 | 0.4755 | 0.3755 | 82.87 | 9.57 | 7.56 |
| 12 | 4.1035 | 0.4993 | 0.4005 | 82.02 | 9.98 | 8.00 |
| 13 | 4.0544 | 0.2005 | 0.7496 | 81.02 | 4.01 | 14.98 |
| 14 | 3.9940 | 0.2997 | 0.6999 | 79.98 | 6.00 | 14.02 |
| 15 | 3.9778 | 0.0249 | 1.0014 | 79.49 | 0.50 | 20.01 |
| 16 | 4.0343 | 0.625 | 0.9020 | 80.71 | 1.25 | 18.04 |
| 17 | 4.0537 | 0.1000 | 0.8503 | 81.01 | 2.00 | 16.99 |
| 18 | 4.0637 | 0.1374 | 0.8000 | 81.26 | 2.75 | 16.00 |
| 19 | 4.1260 | 0.2870 | 0.6000 | 82.31 | 5.73 | 11.97 |
| 20 | 4.6032 | 0.2497 | 0.1506 | 92.00 | 4.99 | 3.01 |
| Pre-prepared samples | ||||||
| B-1 | 79.45 | 0.5 | 20.0 | |||
| B-2 | 84.0 | 1.0 | 15.0 | |||
| B-3 | 88.0 | 2.0 | 10.0 | |||
| B-4 | 91.0 | 4.0 | 5.0 | |||
| B-5 | 91.0 | 6.0 | 3.0 | |||
| B-6 | 91.0 | 8.0 | 1.0 | |||
| B-7 | 89.5 | 10.0 | 0.5 | |||
Table 1. Weights and percent values of all samples.
2. Spectra
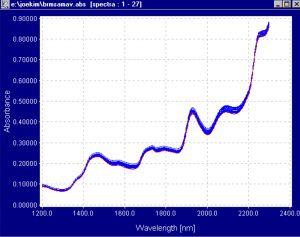
Figure 2. Absorbance spectra of pre-prepared samples and samples prepared by Brimrose.
3. Regressions and Modeling
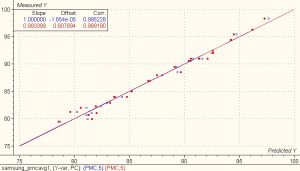
Figure 3. PLS 1 regression model for % PMC.
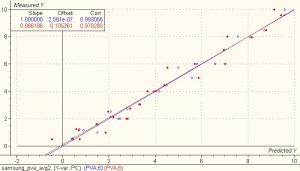
Figure 4. PLS 1 regression model for % PVA
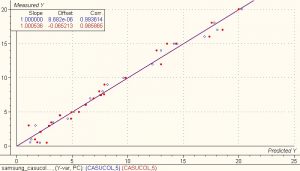
Figure 5. PLS 1 regression model for % Casucol.
The results for these regression models were excellent and showed good correlation between the calibration and validation sets. The regression for PMC had a SEC of 0.55 and an SEP of 0.93 with two outliers removed. The regression for PVS had a SEC of 0.35 and an SEP of 0.61 with one outlier removed. The regression for Casucol had a SEC of 0.66 and an SEP of 0.98 with one outlier removed.
- Predictions
3 data points were removed from the data set and models were created using the remaining
data points. The models were then used to predict the values for the points taken out and these values were compared to the known values. The results were excellent for such a small calibration set. Predictions were then done for the 3 unknown samples.
| CALCULATED PERCENT | PREDICTED PERCENT | |||||
| SAMPLE | % PMC | %PVA | %CAS. | % PMC | %PVA | % CAS. |
| 6 | 90.56 | 4.46 | 4.97 | 90.22 | 5.07 | |
| 7 | 88.49 | 2.52 | 9.00 | 2.17 | ||
| 9 | 85.04 | 7.97 | 6.99 | 8.44 | ||
| 11 | 82.87 | 9.57 | 7.56 | 80.38 | 7.79 | |
| 20 | 92.00 | 4.99 | 3.01 | 1.17 | ||
| B-2 | 84.00 | 1.00 | 15.00 | 1.72 | ||
| B-4 | 91.00 | 4.00 | 5.00 | 91.13 | ||
Table 2. Prediction of % values using models created with these samples removed.
| SAMPLE | % PMC | % PVA | % CASUCOL |
| T-1 | 77.62 | 5.06 | 17.79 |
| T-2 | 85.45 | 2.36 | 11.77 |
| T-3 | 97.92 | 0.64 | 1.44 |
Table 3. Prediction of % values for the 3 unknown samples.
- Conclusions and Recommendations
It is concluded that it is feasible to use the Brimrose AOTF-NIR spectrometer to determine percent values for PMC, PVA, and Casucol. Both the regression models and values for the predictions show good correlation between the known values and the values determined from the spectral data. It is noted that the PVA and Casucol had larger error values than the PMC. This is because the percent values for PVA and Casucol are much smaller than those for PMC. The small number of data points used for this model definitely contributed to the error. The results were excellent considering there were only 24 data points used in each model and past experience has shown that using 100 or more samples will certainly create a more robust model. It is recommended that a purchase order be placed for a Brimrose AOTF-NIR spectrometer to allow for testing of a larger amount of samples which can be used to create a more robust model that can predict percent values for PMC, PVA, and Casucol using spectral data.