Brimrose–AOTF-NIR测定消失模涂料中固体含量和干燥
- 简介
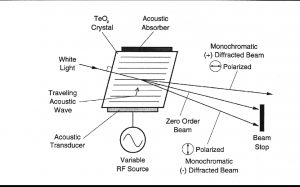
声光可调滤波器(AOTF)的原理基于光在各向异性介质中的声折射。装置由粘在双折射晶体上的压电导层构成。当导层被应用的射频(RF)信号激发时,在晶体内产生声波。传导中的声波产生折射率的周期性调制。这提供了一个移动的相栅,在特定条件下折射入射光束的部分。对于一个固定的声频,光频的一个窄带满足相匹配条件,被累加折射。RF频率改变,光的带通中心相应改变以维持相匹配条件。
光谱的近红外范围从800nm到2500 nm延伸。在这个区域最突出的吸收谱带归因于中红外区域的基频振动的泛频和合频。是基态到第二激发态或第三激发态的能级跃迁。因为较高能级跃迁连续产生的概率较小,每个泛频的强度连续减弱。由于跃迁的第二或第三激发态所需的能量近似于第一级跃迁所需能量的二倍或三倍,吸收谱带产生在基频波长的一半和三分之一处。触简单的泛频以外,也产生合频。这些通常包括延伸加上一个或多个振动方式的伸缩。大量不同合频是可能的,因而近红外区域复杂,有许多谱带彼此部分叠加。
现在,NIRS被用作定量工具,它依赖化学计量学来发展校正组成的参照分析和近红外光谱的分析的关联。近红外数据的数学处理包括多元线性回归法(MLR)、主成分分析法(PCA)、主成分回归法(PCR)、偏最小二乘法(PLS)和识别分析。所有这些算法可以单独或联合使用来得到有价值组成的定性描述和定量预测。
II. 方法
- 背景信息
In the casting process based on the lost foam method, a pattern with the shape and dimensions of the desired part is made from foamed polystyrene. The pattern is then coated by dipping it into a special slurry with one layer of ceramic coating. The coating is designed to prevent the sand used in the casting as a mold from penetrating into the casting and to impart a better surface finish to the part.
The removal of the foamed pattern in order to make the space for the metal takes place by burning and melting caused by the hot metal. This imposes a very critical requirement on the coating. It has to be strong enough so that the hot metal will not chip or break it but it also has to be sufficiently permeable so that the melted polystyrene can escape through it and clear the way for the metal. Failure by the coating to escape fast enough results in trapped foam in the casting or a scrapped casting. It is necessary to control the properties of the slurry in which the patterns are dipped in order to maintain good coating properties. Parameters of interest are the percent solids, viscosity, and possibly level of additives. Another parameter of interest is the rate of drying of the coating due to potential influence on cracking and chipping of the coating.
The purpose of this study to determine the feasibility of fast in line or on line determination of percent solids and drying rate by the AOTF-NIR spectrometer. The study was initially intended to evaluate correlation to viscosity but mainly due to time constraints, this experiment was not carried out.
- Equipment
The spectrometer used was the Brimrose Luminar Free Space with a sampling area of 6×4 mm. This spectrometer collects spectra without contact with the sample from a distance of 40 mm. Each sample was scanned 300 times from 1200nm to 2200nm at 2nm resolution and the scans were averaged into one spectrum. This only requires about 10 seconds. The spectra were collected in transmission mode and post-processed into absorbance.
- Procedure
- A.Percent solids
Ten samples of slurry taken from the experimental casting line were allowed to evaporate water to achieve variations in initial percent solids (PS). Additional variability was then created in the samples by adding water and by accelerated drying in an oven. The PS was determined by using the standard procedure of weighing before and after drying in an oven. This procedure is often referred to as loss on drying (LOD).
For the dilution portion of the experiment a sample of about 360 grams was placed in a bottle and weighed. A sample from the same source was used to collect spectra labeled as zero dilution. Water was added to each bottle in varying quantities from 3ml to 10ml. After each addition the sample was weighed again, shaken well, and a sample was drawn to collect spectra. The bottle was weighed again, and the new weight was used to calculate the next value of PS.
Five samples were taken from five of the bottles and placed in a small aluminum foil cup. These were weighed, spectra were collected, and the samples were placed in an oven at 110° F. After about 10 minutes the samples were removed, weighed, and spectra were collected again. This created samples with higher PS values. Due to lack of precise knowledge of the drying rate, it was found that the change was higher than desired but the experiment was not repeated.
- Drying Experiments
The purpose of these experiments was to see if the spectrometer is able to follow in real time the drying of a sample. The rates can be deduced by following the time intervals at which the spectra are collected. 4 samples of foamed polystyrene were partially coated in the experimental casting slurry. They were weighed, spectra were collected, and the samples were allowed to dry in free air in the room. After several minutes the samples were weighed and spectra were collected again. The drying period was gradually increased because a decrease in drying rate was suspected. The spectra of the polystyrene were collected for use as a background correlation if necessary.
III. Results
- Sample Tables
| Sample # | % solids by weight of additions | % solids by LOD | ||||||
| dilute 1 | dilute 2 | dry 1 | dry 2 | initial | dilute 1 | dilute 2 | ||
| 1 | 42.22 | 42.23 | 42.62 | 42.51 | 42.23 | |||
| 2 | 41.65 | 40.56 | 48.54 | 50.64 | 42.78 | 41.75 | 40.03 | |
| 3 | 41.69 | 41.17 | 46.90 | 49.10 | 42.79 | 41.50 | 40.65 | |
| 4 | 42.18 | 41.67 | 48.10 | 50.60 | 42.73 | 42.83* | 41.92 | |
| 5 | 42.00 | 42.00 | 42.57 | 42.08 | 41.94 | |||
| 6 | 42.34 | 41.19 | 42.34 | 43.03* | 41.65 | |||
| 7 | 42.38 | 41.24 | 42.72 | 42.70 | 41.03 | |||
| 8 | 41.64 | 40.53 | 42.43 | 42.07 | 40.59 | |||
| 9 | 42.30 | 41.18 | 46.60 | 49.10 | 42.87 | 42.78 | 40.81 | |
| 10 | 42.65 | 42.65 | 46.50 | 48.70 | 42.65 | 42.98 | 42.67 | |
Table 1. PS in various samples, as determined by weighing, additions of water, weighing, calculations, and determination by LOD on samples used for spectra.
This table provides the values determined by two methods. The first was initial weighing, addition of water, weighing again, and calculating the new PS. The second method was taking the sample after collection of the spectra and using the LOD method for determination of PS. The table also shows the PS calculated from the drying of the five samples. There was a significant level of error in both methods. The degree of error is evident in several cases such as in sample 10. There were no additions to this sample and it gave a value of 42.98 by the LOD, which is higher than the initial. Sample 3 gave lower values by the LOD method than those calculated by the additions, which could indicate that the initial value was incorrect. This level of possible error has a very strong effect on the ability to produce reasonable calibrations by the NIR method.
| Sample | 1 | 2 | 3 | 4 | ||||
| time | % solids | Time | % solids | Time | % solids | Time | % solids | |
| 8:32 | 43.00 | 8:32 | 43.00 | 8:33 | 43.00 | 8:33 | 43.00 | |
| 8:41 | 44.60 | 8:36 | 44.10 | 8:39 | 44.30 | 8:37 | 44.00 | |
| 8:47 | 45.75 | 8:43 | 45.22 | 8:46 | 45.60 | 8:44 | 45.14 | |
| 8:57 | 47.45 | 8:49 | 46.66 | 8:55 | 47.35 | 8:51 | 46.44 | |
| 9:07 | 49.42 | 8:58 | 48.35 | 8:55 | 49.35 | 8:51 | 48.14 | |
| 9:21 | 52.30 | 9:12 | 51.06 | 9:18 | 52.00 | 9:13 | 51.04 | |
| 9:35 | 53.67 | 9:25 | 54.25 | 9:31 | 55.33 | 9:27 | 54.28 | |
| 9:57 | 60.92 | 9:48 | 59.00 | 9:52 | 59.40 | 9:50 | 59.20 | |
| 10:21 | 64.10 | 10:11 | 61.60 | 10:17 | 61.73 | 10:14 | 61.32 | |
Table 2. PS as function of drying time in air, based on weighing samples of coating on a foamed polystyrene sample.
The results of the weight loss vs. time presented as PS are given in Table 2. The values of PS were not known exactly because the coating was done in the experimental tank and actual real time values were not available. An initial value of 43.00% was used. The exact actual value is not critical because we want to look at the drying itself. The results of the weighing of these samples were much more consistent, which contribute significantly to the results obtained later by the NIR method.
2. Spectra
A.PS Experiment

Figure 2. Absorbance spectra of all the samples of the PS experiment.

Figure 3. Second derivative of the absorbance spectra from the samples of the PS experiment.
The second derivative spectra from the PS samples indicate that the wavelength areas of 1210, 1386, 1410, 1780, and 1900nm should contribute to the calibration model. The picture revealed here shows that a full range of spectra holds much more information than a range based on discrete wavelengths, which is the case with a spectrometer based on filters.
It can be deduced from the spectra that the large absorbance peaks in the 1410nm and 1900 nm are definitely associated with the absorption of water. Other absorbance peaks can be possibly linked with the solids or with other constituents in the slurry.
B. Drying Experiment
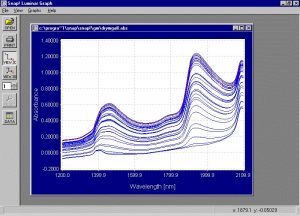
Figure 4. Absorbance spectra collected from the samples in the drying experiment.
This graph clearly shows the decrease in water absorption as the samples get drier. It is very important to pay attention to the spectral region around 1380nm to 1460 nm. When the water level is still high the peaks at 1460nm and 1940nm are dominant and it is clear that the water level causes these peaks. As water evaporates, the peaks at 1450nm and 1940nm almost completely disappear. However, the peak between 1380nm and 1410nm does not diminish in the same way. This peak is important because it is probably associated with the solids. If this is true this wavelength range can be an important area in determination of PS.
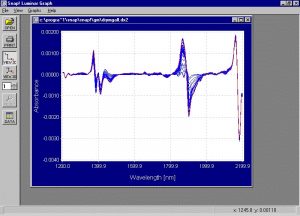
Figure 5. Second derivative of the absorption spectra collected from the samples of the drying experiment.
The second derivative spectra of the PS samples show that the wavelength areas of 1210, 1384, 1411, 1464, 1780, 1900 and 1965 nm should contribute to the calibration model. These are similar to the wavelength areas that should contribute to the calibration model in the PS experiment.
2. Regressions and Modeling
A. PS Experiment
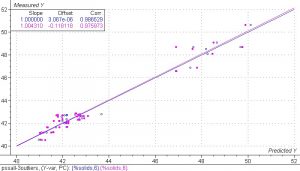
Figure 6. PLS 1 regression model of the spectra collected from the PS experiment, including the drying samples.
The results of this model show good correlation between the NIR spectra and the PS. It is important to understand that because of the types of errors seen in the reference methods, the correlation over a wide range is usually better than the correlation over a narrow range. In this case the narrow range would be around 42-44%. A very accurate reference method will be necessary to obtain a robust model over this range. The small number of sample points also contributes some error in this model.
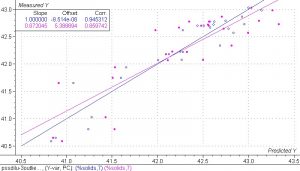
Figure 7. PLS 1 regression model of the spectra collected in the PS experiment in the narrow range obtained by the additions of water only.
Close examination of the results in this model indicates that the calibration set produces a good correlation but the validation set does not. The calibration set has a correlation coefficient of 0.945 and a SEC of 0.23%. The validation set has a correlation coefficient of 0.859 and an SEV of 0.38%. There is also a large difference in the slopes of the calibration set and validation set. The validation set is much more sensitive to the reference errors in the experiment. The small number of sample points also contributes to the error in the validation set. Despite the errors, the results are quite good and indicate that a robust calibration model could be obtained by using a larger data set with more accurate reference data values.
B. Drying Experiment
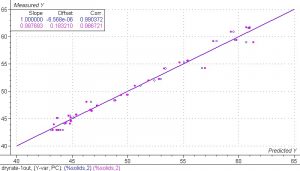
Figure 8. PLS 1 regression model for the spectra collected from the samples in the drying experiment.
The results from the PLS 1 regression model of the spectra collected from the samples in the drying experiment are excellent. The SEC and SEV are equal to 0.75% and 0.94%. Both the calibration set and the validation set have very good correlation. The correlation coefficient for the calibration set is equal to 0.990 and the correlation coefficient for the validation set is equal to 0.986.
IV. Conclusions and Recommendations
It is concluded that the AOTF-NIR spectrometer can be an ideal tool for the on-line control of the foamed polystyrene coating process. The necessary parameters to be measured from the dip tank can be correlated to spectral data and this data can be obtained using either a Brimrose Free Space on a sample removed from the tank or by dipping a probe into the tank. It may be more useful to dip a probe into a tank from a foundry point of view because it then becomes easier to use one system in a foundry and have the probe moved from one tank to another on a QC routine or on a need basis. The Brimrose instruments are very rugged, insensitive to mechanical vibrations, and would be ideal for either of these applications. The Luminar Free Space spectrometer is an ideal tool for real-time monitoring of the drying process in either a conveyor type oven or in a cabinet batch type oven. The optical module can be fixed in a designated position and the conveyor track can present the pattern to it in a designed way. It may be possible to use a Multiplexer spectrometer and several probes to monitor more than one location in the drying oven, which would reduce the price per point dramatically. It will be necessary to verify this possibility through further testing. It is also easy to see other potential applications using the Brimrose instrument, such as testing moisture in the sand as it is formed into the molds into which the metal is cast. It is recommended that more extensive testing be done using a larger data set with more accurate reference values to create a more accurate and robust calibration model.