光谱法测量喷雾化学溶液中乙醇和薄荷醇的百分比含量
总结
通过对乙醇和薄荷醇溶液不同比例样品的研究表明,在喷雾溶液中实时测定乙醇和薄荷醇百分比含量是非常可行的。可以通过安装带单根光纤光缆和透反射探头的AOTF-NIR Luminar 在线红外光谱仪来实现。用于混合溶液的每个容器都会安装一个透反射探头。Brimrose光谱仪对成分的扫描和测定率很高,从而能够更有效地控制每个添加的成分。系统安装之后,可以使用额外的通道来检查测量合成薄荷醇与天然薄荷醇含量的可行性,以便混合时不使用过量的更昂贵的天然薄荷醇。
AOTF-NIR光谱仪及其耐用坚固,对机械振动和环境光变化不敏感,是生产线实施的理想工具。此外,它们像全光束光谱仪一样工作,因此非常适合在线监测,无需执行频繁的背景校正和校准。
- Introduction
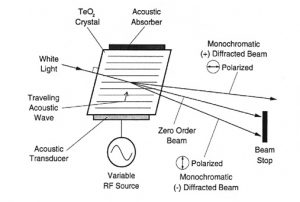
The principle of the Acousto-Optic Tunable Filter (AOTF) is based upon the acoustic diffraction of light in an an-isotropic medium. The device consists of a piezo-electric transducer bonded to a birefringent crystal. When the transducer is excited by an applied RF signal, acoustic waves are generated in the crystal. The propagating acoustic wave produces a periodic modulation of the refractive index. This provides a moving phase grating that under proper conditions will diffract portions of an incident light beam. For a fixed acoustic frequency, a narrow band of optical frequencies satisfies the phase matching conditions and be cumulatively diffracted. As the RF frequency is changed, the center of the optical band-pass is changed accordingly so that the phase matching condition is maintained.
The near infrared region of the spectrum extends from 800nm to 2500nm. The absorption bands which are most prominent in this region are due to overtones and
combinations of the fundamental vibrations active in the mid infrared region. The energy transitions are between the ground state and the second or third excited vibrational states. Because higher energy transitions are successively less likely to occur, each overtone is successively weaker in intensity. Since the energy required to reach the second or third excited state is approximately twice or three times that needed for a first order transition and the wavelength of absorption is inversely proportional to the energy, the absorption bands occur at about one-half and one-third the wavelength of the fundamental. In addition to the simple overtones, combination bands also occur. These usually involve a stretch plus one or more bending of rocking modes. Many different combinations are possible and therefore the NIR region is complex, with many band assignments unresolved.
Near Infrared Spectroscopy is currently being used as a quantitative tool which relies on chemometrics to develop calibrations relating a reference analysis of the constituent to that of the NIR optical spectrum. The mathematical treatment of NIR data includes Multi Linear Regression (MLR), Principle Component Analysis (PCA), Principle Component Regression
(PCR), Partial Least Squares (PLS) and discriminant analysis. All of these algorithms can be used singularly or in combination to yield the resultant goal of quantitative prediction and qualitative description of the constituents of interest.
2. Methodology
- Data Collection
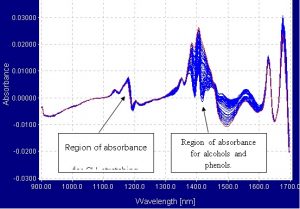
The spectrometer used was a Brimrose AOTF-NIR Luminar spectrometer connected to 600-micron single fiber optic cables. The fibers were then connected to a Brimrose custom designed cuvette holder, which was able to secure the cuvette. The effective pathlength of the cuvette was 2mm. Samples of menthol and ethanol were mixed in different proportions. Each sample was scanned 75 times from 900nm to 1700nm and the scans were averaged into one spectrum. The region between 900nm and 1700nm is the most ideal range in which to work because the first overtone of alcohols occurs in the 1405nm to 1425nm range and the second overtones of CH3 stretching bonds occur in the 1192nm to 1200nm range. The spectra were collected in transmission mode and processed into absorbance and first derivative.
- Results
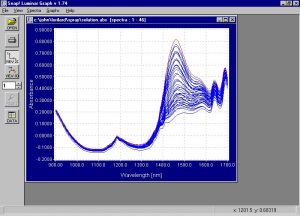
- Spectra
- Modeling and Regressions
The first derivative data shown above were used for performing the calibration and validation calculations using the chemometrics software package Unscramblerä from Camo. A PLS1 full cross validation method was used for modeling. The model for the first derivative spectra clearly showed better results than the model for the absorbance spectra. The correlation for both the calibration and validation set for ethanol and menthol is 0.99 and the SEP is 0.648 and 3.805 respectively.

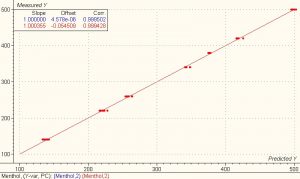
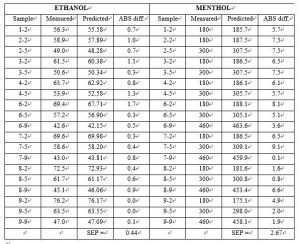
- Predictions
Nineteen samples were used as a test set to validate the model. The standard deviation of differences between measured and predicted (SEP) for the 19 test set samples of ethanol and menthol was 0.44 and 2.67 respectively.