- 操作摘要
使用Brimrose AOTF-NIR光谱仪收集不同水杂质水平的甲醇样品的光谱数据,结果是极好的,并且证明了Brimrose AOTF-NIR光谱仪可以用于定量测定甲醇中低含量水分杂质。利用Brimrose AOFT-NIR光谱仪收集的数据,用部分最小二乘回归法创建一个预测模型,该模型的SEP值为每1000PEM中18.8PPM,测量值和预测值之间的相关系数为0.9982。这些数据表明,Brimrose光谱仪可以用于定量测量甲醇中的水杂质,误差极低。同时也可以测量和建模甲醇的其他特性,但在这篇文章中只讨论测量PPM中的水分含量。Brimrose光谱仪的测量速度和稳定性使其成为过程控制的理想工具。AOTF技术允许快速扫描,没有移动部件,可以实现实时在线过程控制。可以输出描述水分杂质水平实时变化的趋势图,可以预先设定高低警告级别和高低报警级别,这些参数可以用于过程控制。实时分析可以比其他方法更快速的出结果,并可以用于在很短的时间内优化过程。总体而言,本研究结果表明,利用Brimrose AOTF-NIR光谱仪和校准模型获得的光谱数据,用来测量甲醇中的低含量水分杂质是非常可行的。
- 简介
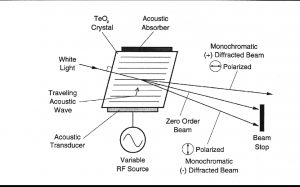
声光可调滤波器(AOTF)的原理基于光在各向异性介质中的声折射。装置由粘在双折射晶体上的压电导层构成。当导层被应用的射频(RF)信号激发时,在晶体内产生声波。传导中的声波产生折射率的周期性调制。这提供了一个移动的相栅,在特定条件下折射入射光束的部分。对于一个固定的声频,光频的一个窄带满足相匹配条件,被累加折射。RF频率改变,光的带通中心相应改变以维持相匹配条件。
光谱的近红外范围从800nm到2500 nm延伸。在这个区域最突出的吸收谱带归因于中红外区域的基频振动的泛频和合频。是基态到第二激发态或第三激发态的能级跃迁。因为较高能级跃迁连续产生的概率较小,每个泛频的强度连续减弱。由于跃迁的第二或第三激发态所需的能量近似于第一级跃迁所需能量的二倍或三倍,吸收谱带产生在基频波长的一半和三分之一处。触简单的泛频以外,也产生合频。这些通常包括延伸加上一个或多个振动方式的伸缩。大量不同合频是可能的,因而近红外区域复杂,有许多谱带彼此部分叠加。
现在,NIRS被用作定量工具,它依赖化学计量学来发展校正组成的参照分析和近红外光谱的分析的关联。近红外数据的数学处理包括多元线性回归法(MLR)、主成分分析法(PCA)、主成分回归法(PCR)、偏最小二乘法(PLS)和识别分析。所有这些算法可以单独或联合使用来得到有价值组成的定性描述和定量预测。
III. Methodology
200ml of HPLC grade methanol was measured and placed in a 250ml beaker. Approximately 2 ml of the sample was placed in a 5mm pathlength quartz cuvette for the initial measurement. 100 scans were collected per reading and averaged into one spectrum. Wavelength range was from 1550nm to 2050nm with 2nm resolution. Data were collected in ratio mode to account for any variations in the power source using a Brimrose AOTF-NIR Luminar spectrometer with fibers attached to a cuvette holder. The cuvette containing the pure methanol was placed in the cuvette holder and spectral data were collected in transmission mode. After data collection, the sample that was in the cuvette was placed back in the beaker. Distilled water was added to the beaker to simulate water impurities in a methanol stream. 50 ppm (approximately 0.01 ml) of water was added to the beaker and the mixture was scanned. This process was repeated until the total amount of water in the mixture was 1000 ppm. A total of 21 samples were scanned. The transmission data were processed into absorbance and the absorbance data were used to create a calibration model. In a process setting, fewer scans per spectrum would allow a measurement to be taken every one to two seconds.
IV.Results
- Spectra
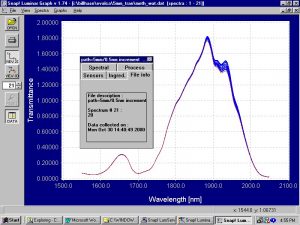
Figure 2. Transmittance spectra of methanol with water added at 50 ppm increments
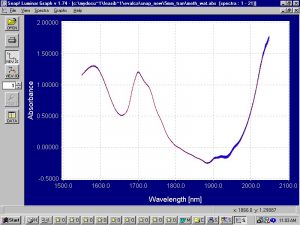
Figure 3. Absorbance spectra of methanol with water added at 50 ppm increments.
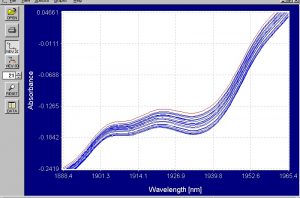
Figure 4. Enhanced absorbance spectra of methanol and water from 1888nm to 1965nm
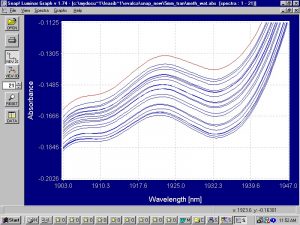
Figure 5. Enhanced absorbance spectra of methanol and water from 1900nm to 1950nm.
The absorbance spectra of the methanol with water added clearly shows changes in the water absorbing region from 1900nm to 1950nm. This is the area where one would expect to see differences in spectral data due to changes in water content. The PLS 1 regression model will confirm that the Brimrose spectrometer is able to readily quantify water content in methanol using spectral data and a regression model.
- Regressions and Modeling
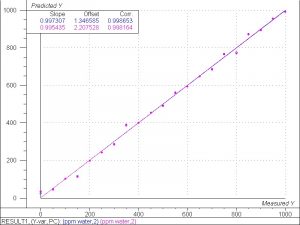
Figure 6. PLS 1 regression model for water in methanol
The results for this model are excellent and show good correlation between the amount of water in methanol and the spectral data. The correlation coefficient is equal to 0.9986, the SEC is equal to 16.1, and the SEP is equal to 18.7. These numbers confirm that it is feasible to measure trace amounts of water in methanol. The results will be even better when a larger sample set of 100 or more data points is used for the calibration model.
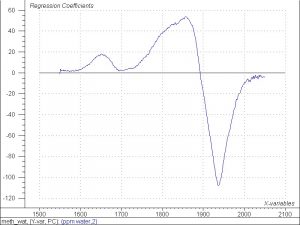
Figure 7. Regression coefficients for PLS 1 model correlating spectral data to water in methanol.
The regression coefficients indicate the wavelength regions from which the model is taking the relevant information. The model clearly takes most of the information from the 1950nm region, which is the region where water absorbs. The regression coefficients confirm that the model is taking the information from the wavelength range where spectral changes occur due to changes in water.
- Conclusions and Recommendations
The results of this study show that it is feasible to quantitatively measure trace amounts of water in methanol using spectral data obtained from the Brimrose AOTF-NIR spectrometer and a calibration model. The results were especially good considering the small size of the sample set used for the calibration model. Past experience has shown that using a sample set of 100 or more data points will make a model more accurate and robust. Past experience has also shown that a calibration model generated from laboratory data can easily be transferred to a real-time, on-line setting. The numbers for the model were excellent and the regression coefficients confirm that the model takes its information from the water absorbing region around 1950nm. The signal to noise ratio was very high and a calibration model created from a larger sample set should be able to quantitatively analyze trace amounts of water in methanol to about 10ppm or less. The Brimrose spectrometer is the ideal tool for real-time on-line process control because of its speed and lack of moving parts. A multiplexed spectrometer can use up to 16 channels to measure and analyze data at 16 different process points. Calibration models can be used to measure different parameters in different chemicals and it will be possible to take a reading for each channel within one to two minutes. It is recommended that a purchase order be placed for a Brimrose AOTF-NIR Luminar spectrometer to allow for further calibration and testing.